


The scale of the threat
Mapping the industrialisation of Norfolk’s countryside.
Across Norfolk, tens of thousands of acres of productive farmland and open countryside are at risk from large-scale solar proposals.
Four Nationally Significant Infrastructure Projects (NSIPs) – East Pye, Tasway, High Grove, and Blofield – are at various stages of the planning process, alongside numerous smaller commercial schemes.
When viewed together, the picture is stark: solar and associated energy infrastructure could transform Norfolk’s rural landscape more dramatically than any change in living memory.
What the data shows
Scale
The cumulative area affected exceeds that of Norwich itself and approaches 15% of the Broads National Park.
Distribution
Proposals are concentrated across South and West Norfolk, but no district is unaffected.
Overlap
Several projects border each other, creating continuous industrial zones of fencing, cabling, and battery storage.
Infrastructure creep
Each new site requires substations, pylons, or cable corridors, spreading visual and ecological impacts far beyond their boundaries.
Why it matters
Viewed on a map, this is not a story of one or two solar farms, it’s a re-engineering of Norfolk’s rural fabric.
These developments risk fragmenting wildlife habitats, displacing agricultural communities, and permanently altering our county’s character.
CPRE Norfolk’s mapping work shows clearly that Norfolk is being asked to take an unfair share of England’s solar burden, while rooftop and brownfield potential remains underused.
Mapping the scale of industrialisation in Norfolk
Large-scale solar schemes (including four NSIP projects over 100MW) are being proposed across tens of thousands of acres of Norfolk’s countryside. To help the public understand the true extent of potential land loss, landscape impacts, countryside fragmentation and infrastructure spread, CPRE Norfolk has produced detailed cumulative impact maps for both South and West Norfolk.
These maps bring together multiple live and emerging proposals, including solar fields, BESS compounds, new substations, cabling corridors, and pylon routes, to show how widespread industrialisation could be across our county’s farmland and landscapes.
CLICK EACH MAP FOR A LARGER IMAGE
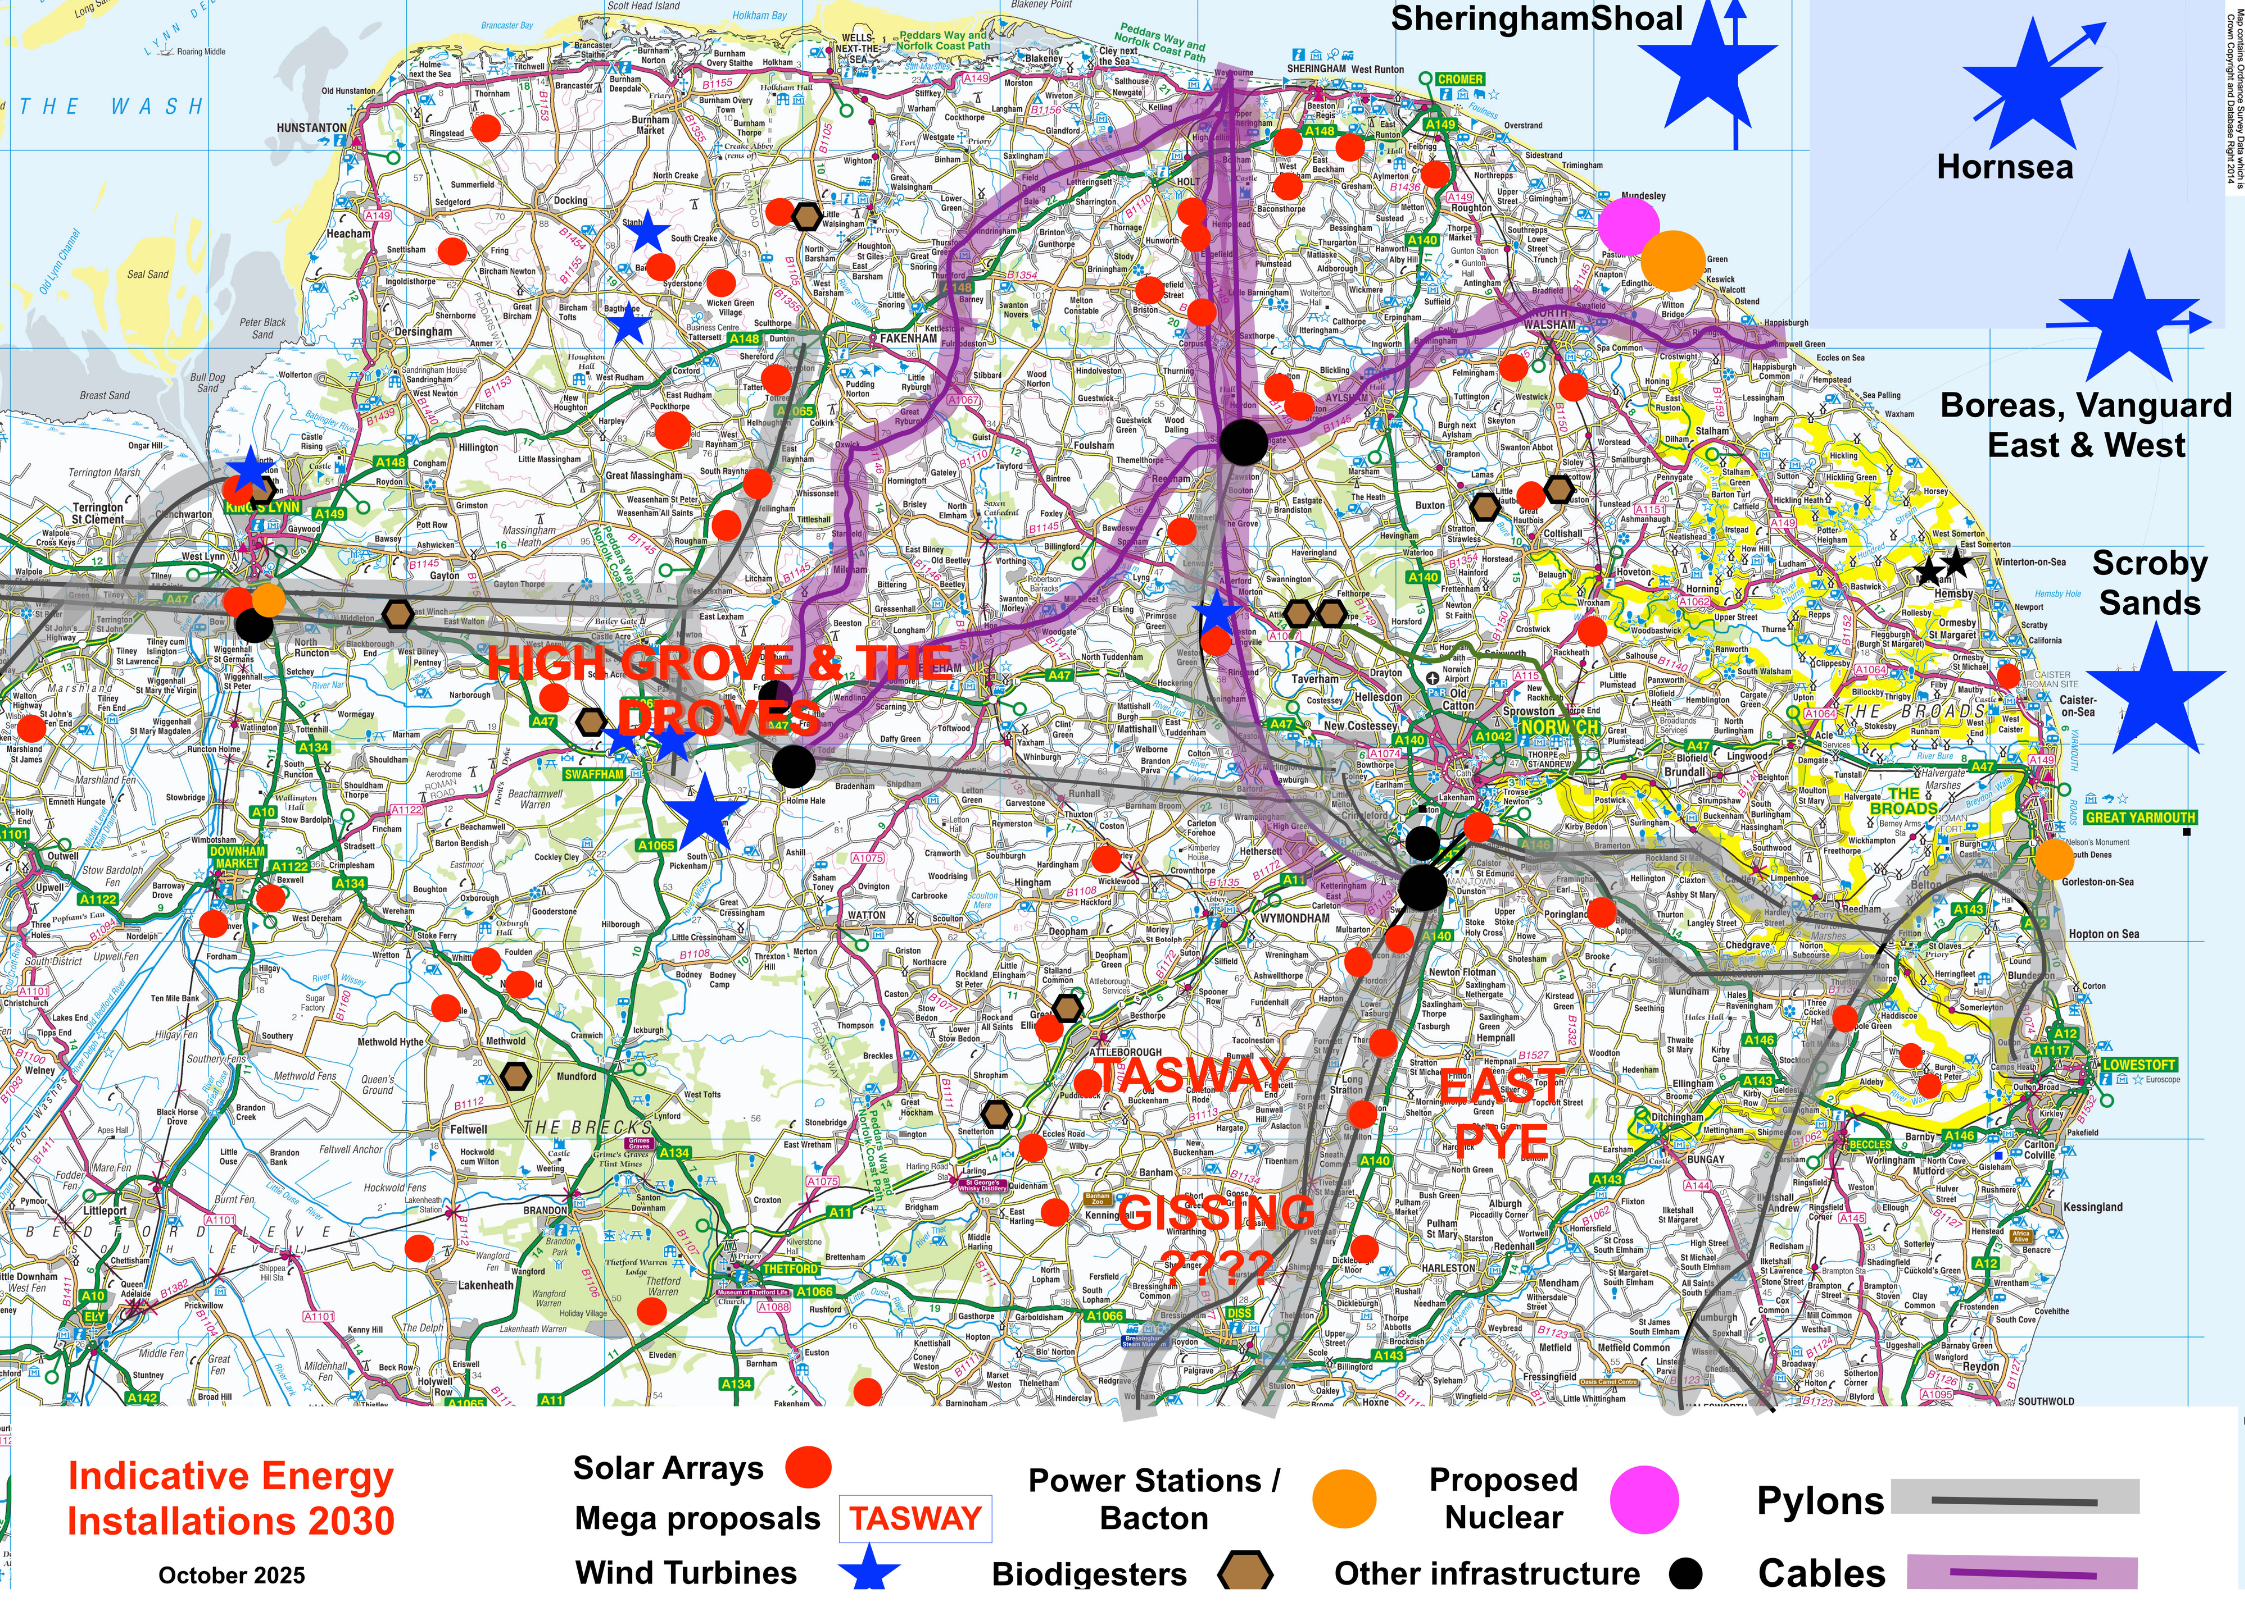
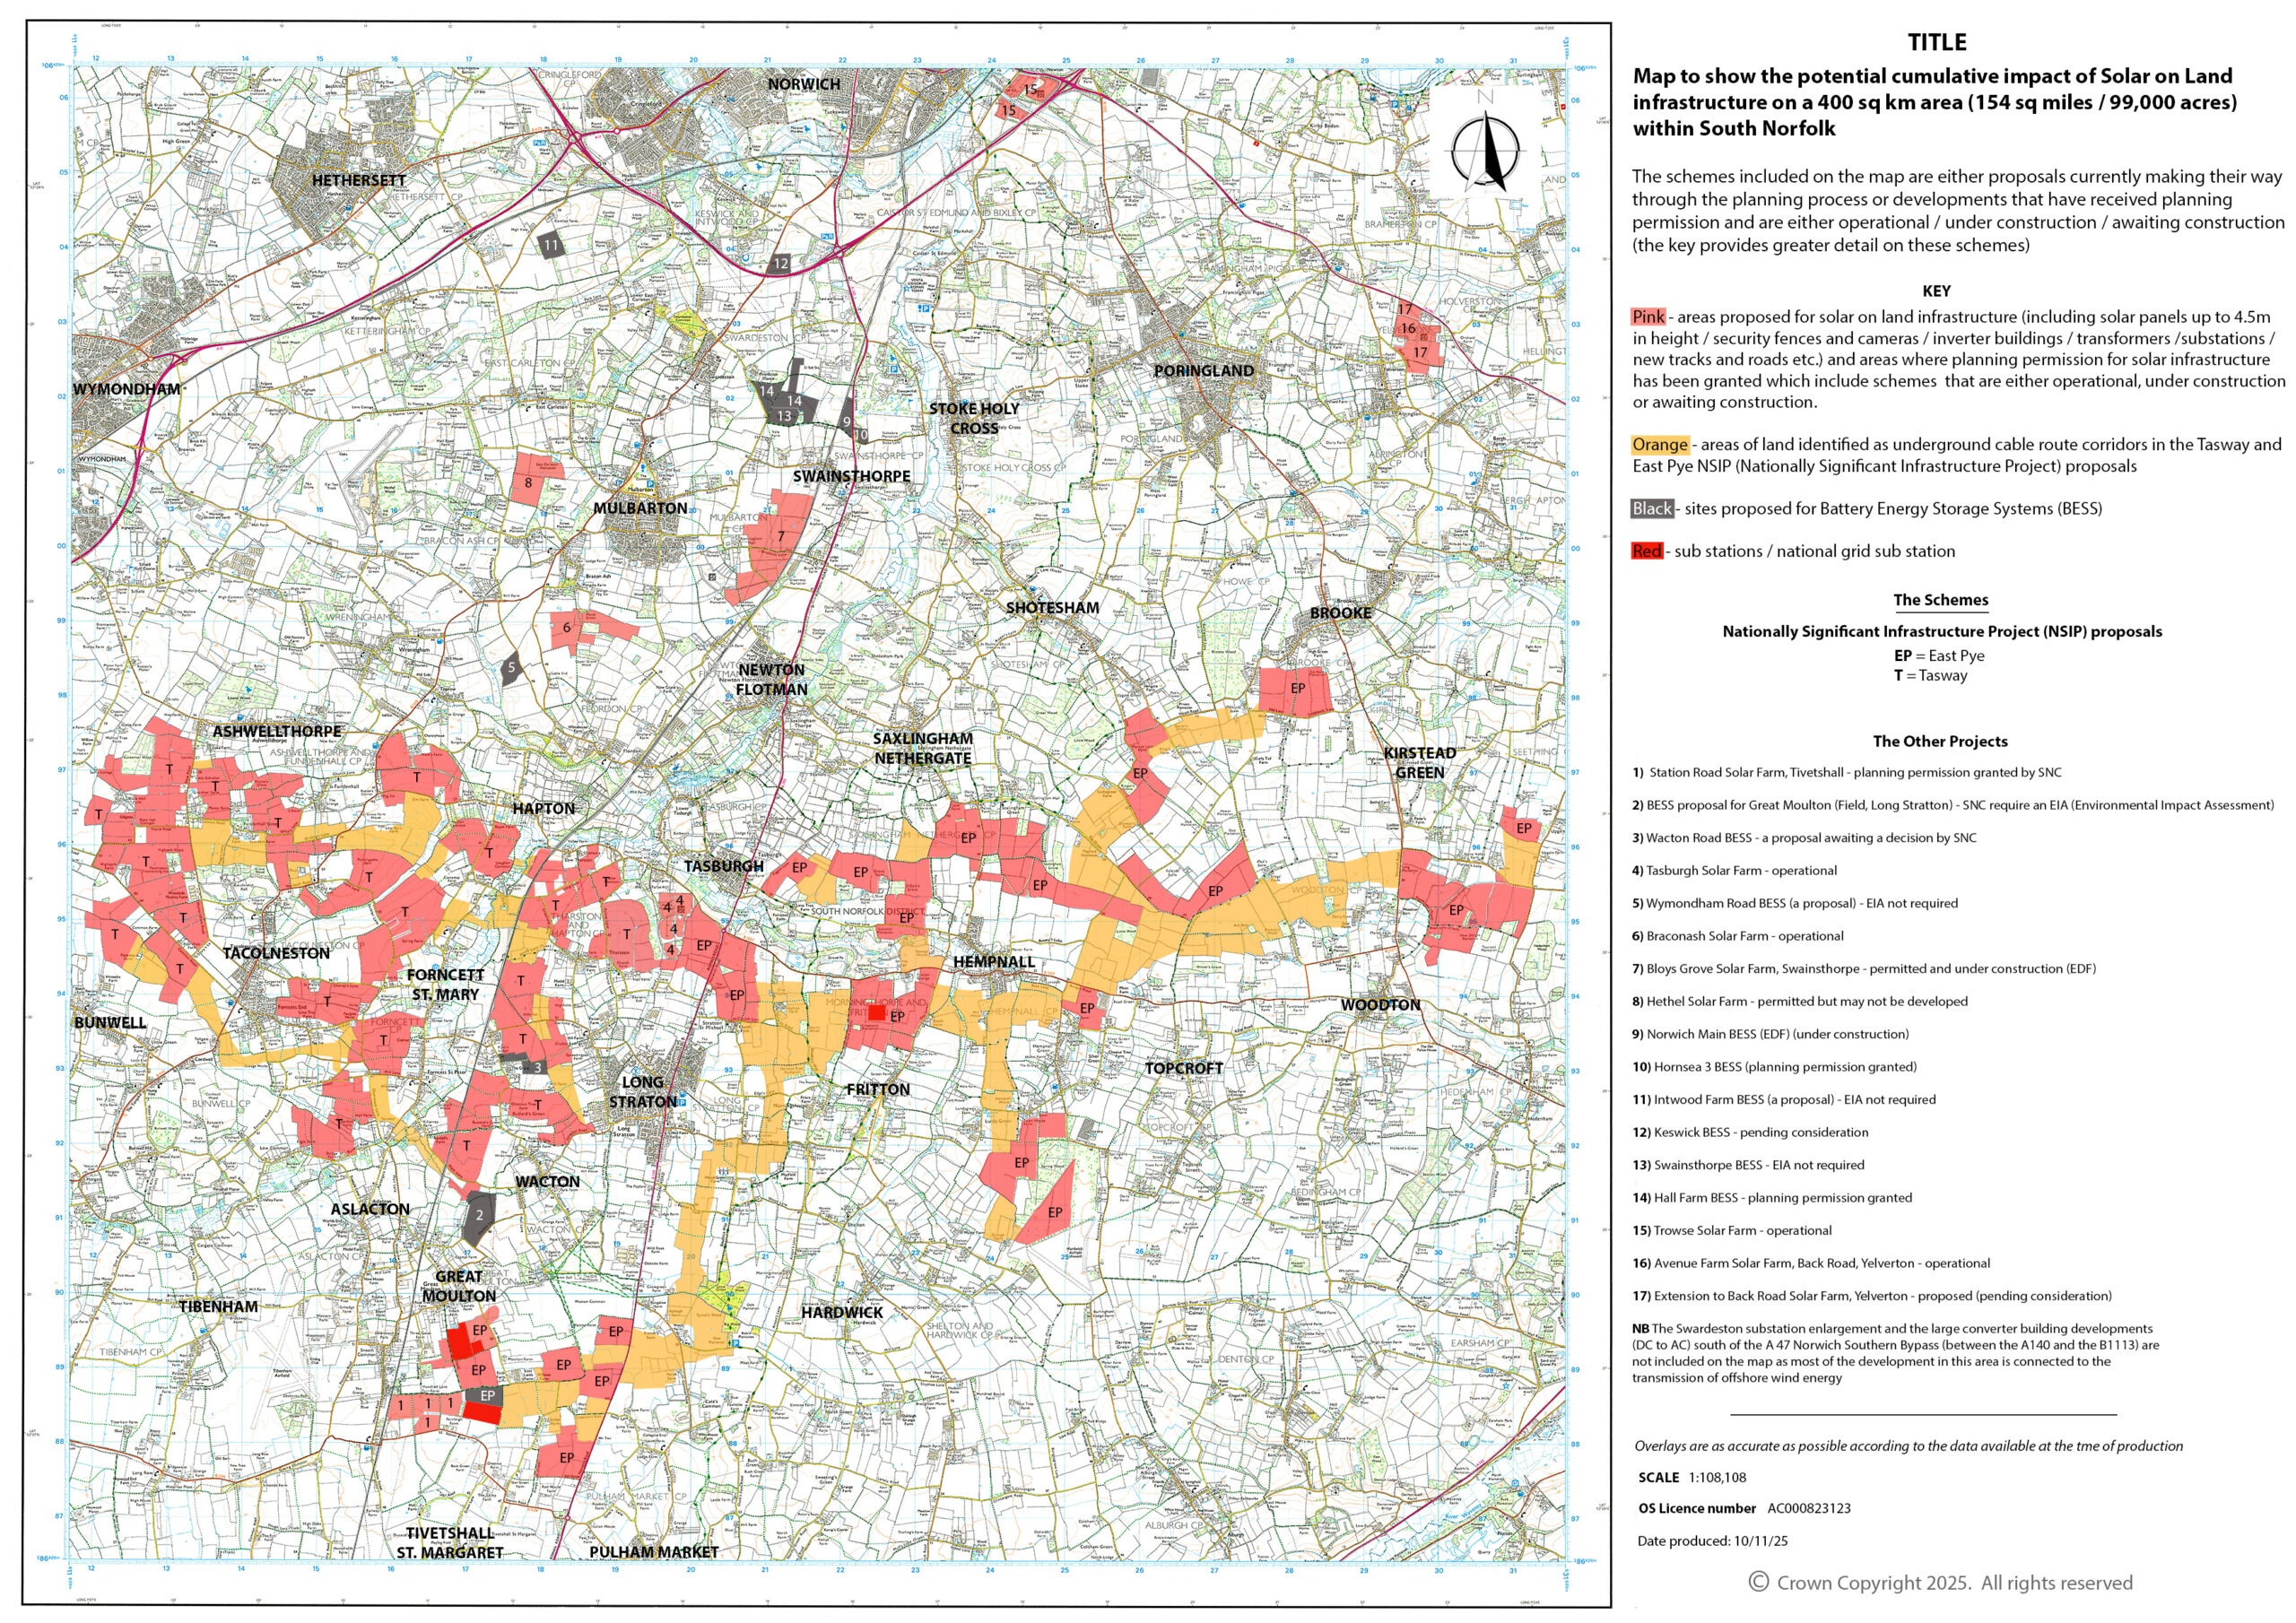
South Norfolk – Cumulative Impact Map
Created by CPRE Norfolk’s David Hook and Will Walker, this map shows the cumulative impact of all proposed and approved large-scale solar schemes across South Norfolk.
It includes:
- All four NSIP proposals (100MW+)
- Other solar on land schemes that are not classed as NSIP proposals
- Battery Energy Storage Systems (BESS)
- Substations and cabling corridors
- Villages, lanes, and landscapes affected by industrialisation pressures
CLICK FOR A LARGER IMAGE
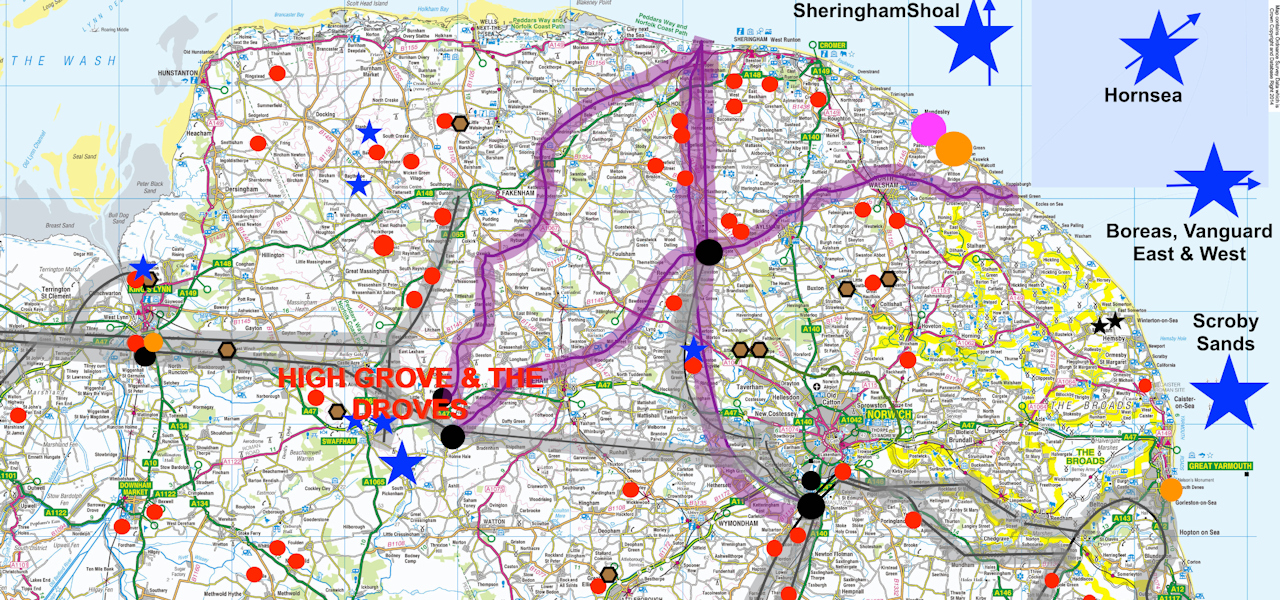
West Norfolk – Solar Proposals Overview Map
This map, produced by Fraser Bateman for CPRE Norfolk, shows the pattern of solar development proposals across West Norfolk, highlighting:
- The spread of proposed solar sites
- Landscape areas at risk
- Proximity to settlements
- Infrastructure corridors and cumulative pressures

CLICK FOR A LARGER IMAGE
Keep reading
Next page –> Impact on Norfolk – farming and food security
Or jump to…
-
Welcome to the Getting Solar OFF the Land exhibition
-
Who we are – the countryside charity for Norfolk
-
What “Mega Solar” means for Norfolk
-
Why Mega Solar? Why Now?
-
Impact on Norfolk – farming and food security
-
Impact on Norfolk – communities and homes
-
Impact on Norfolk – landscapes and tranquillity
-
Impact on Norfolk – wildlife and biodiversity
-
Impact on Norfolk – tourism & the local economy
-
Impact on Norfolk – Public Rights of Way
-
Renewables Done Well – the smarter, fairer way to achieve Net Zero
-
Community Action – Standing together for Norfolk’s countryside
-
Leading the fight – our research, policies and public engagement
-
What you can do – be part of the solution
-
What CPRE Norfolk asks for
This page is based on the exhibition board “The Scale of the Threat” from CPRE Norfolk’s Getting Solar OFF the Land Exhibition (2025).
Sources:
CPRE Norfolk, 2025 – Map of Norfolk Solar NSIPs and Associated Infrastructure.
SolarQ, 2024 – “Getting Solar Off the Ground.”

Donate to CPRE Norfolk
Donate